 |
Nuclear Power in a Post-Fukushima World -2
|
Category: ECO |
Mycle Schneider, Antony Froggatt, & Steve Tohmas |
up 11y15 |
Title
Nuclear Powr in a Post-Fukushima World -2
福島後の世界の原子力
Index
-
-
-
-
-
-
-
-
-
-
-
-
-
-
-
-
-
-
Tag
30 countries; 437 reactors; 2,558 TWh (2009); 370 GW capacity; US-104, Fr-59, Jp-54, Ru. Kr, De, 3/4; Cn, In, Ru, Kr; Life time 40 years; 13% share
Why?
- Nuclear industry is all-round and comprehensive; including not only political, economical, social, and environmental impacts, but also relating to the life style beyond present generations.
- Japanese nationals have been evaluated worldwide as the most delicate, nervous, or even paranoic characters showing particular ability and sense in manufacturing and designing of products, services, including hospitality spirit.
- Made-in-Japan has been our proud brand name in the global market.
- Why Fukushima, literally means 'Lucky Island', tragedy has occured in such a country full of cognosecenti?
- 原子力産業は、政治的、経済的、社会的、環境的な影響のみならず現在の世代を越えたのライフスタイルに関連する普遍的な産業である。
- 日本人は、最も繊細で、神経質で、妄想的ですらあると言われ、商品サービスの物作りやデザイン、そのおもてなし精神も含め能力とセンスがあると世界から評価されてきた。
- メイドインジャパンは、世界市場において我々の誇るべきブランドであった。
- 福島、(文字通り福の島)の悲劇は、なぜこのような専門家集団の多い国で起きたのか?
English original
Japanese (abridged translation)
>Top
3. General Overview Worldwide::
- As of 2010, a total of 30 countries were operating nuclear fission reactors for energy purposes—one fewer than in previous years. Lithuania became the third country ever to revert to“non-nuclear energy" status, following Italy, which abandoned nuclear power after Chernobyl, and Kazakhstan, which shut down its only reactor in 1999.
- Nuclear power plants generated 2,558 Terawatt-hours (TWh or billion kilowatt-hours) of electricity in 2009. World nuclear production fell for the third year in a row, generating 103 TWh (nearly 4%) less power than in 2006. This decline corresponds to more than the domestic annual nuclear generation in four-fifths of the nuclear power countries. The gap between the public's perception of an increasing role for nuclear power and reality seems to be widening.
- The main reasons for nuclear's poor global performance are linked to technical problems with the reactor fleets of larger nuclear players, with the small producers remaining more or less stable. Between 2008 and 2009, nuclear generation declined in four of the "big six" countries—France, Germany, South Korea, and the United States. In Japan, the industry had been slowly recovering from the 2007 Kashiwasaki earthquake, and in Russia, production remained stable. These six countries generate nearly three-quarters (73% in 2009) of the world's nuclear electricity, a share that increased in 2009. In 2010, the nuclear role of four of the "big six" remained stable while two (Germany and South Korea) declined.
- Many countries are now past their nuclear peak. The three phase-out countries (Italy, Kazakhstan, and Lithuania) and Armenia generated their historical maximum of nuclear electricity in the 1980s. Several other countries had their nuclear power generation peak in the 1990s, among them Belgium, Canada, Japan, and the UK). And seven additional countries peaked between 2001 and 2005: Bulgaria, France, Germany, India, South Africa, Spain, and Sweden.
- Among the countries with a remarkably steady increase in nuclear generation are China, the Czech Republic, Romania, Russia and the United States (except for 2009 when production dropped by almost 10 TWh). Considering the size of the U.S. program, the rather continuous improvement of the load factor is impressive (88 % in 2009). Russia is also generally on an upward trend (78.3 %), and South Korea is fluctuating at a very high level (90.3 %). France (at a 70.6 % load factor), Japan (66.2 %), and Germany (69.5 %), which are already on the lower end of the performance indicator, for varying reasons, have exhibited a further downward trend over the past few years.
3. 世界原子力産業の概況:
- 2010年現在、原発を稼働している国は30ヶ国であり、これは前年より1カ国減少。リトアニアが脱原発に転じたため。伊も脱原発となり、カザフスタンは唯一の原発を1999年に閉鎖。
- 原発は2009年に2558 TWhを発電。これは世界の原発による発電量は3年連続で減少し、2006年のレベルより4%少ない103 TWh少ない。この減少は原発推進国の4/5で国内年間原発発電量よりも落ち込んだ。一般の原発の役割増大への期待と実際の発電量とのギャップが拡大。
- 原発による発電量不調の主な理由は、中小国はまあまあだったが、大口国による技術問題が関連している。2008-2009年に原子力発電は、仏・独・韓・米の六大国で減少が響いた。日本は2007年の中越地震以降暫時回復してきたおり、露の発電は安定的に推移。これら六大国で世界の原子力発電の約3/4 (2009年には73%)を占めており、2009年にはこのシェアを拡大。2010年には六大国の内4ヶ国は安定推移し、残り独・韓の2ヶ国が減少させた。
- 多くの国では原発ピークは過去のもの。脱原発に転じた3ヶ国 (伊、カザフスタン、リトアニア)および米国は1980年代に原子力発電のピークを迎えた。その他ベルギー、加、日本、英国は1990年代に、ブルガリア、仏、独、印、南ア、西、スウェーデンの7ヶ国は2001-2005年にピーク。
- 着実な増加をしているのが、中、チェコ、ルーマニア、露、米(2009年は例外で10TWh減少) である。米国の発電計画の規模を考えれば、稼働率88% (2009)はむしろ目覚ましい。露は稼働率が上昇 (78.3%)、韓は90.3%の高水準であり、仏は70.6%、日本は66.2%、独は69.5%で稼働率は低い方。これは過去数年の傾向は下降気味。
- Overview of Operation, Power Generation, Age Distribution
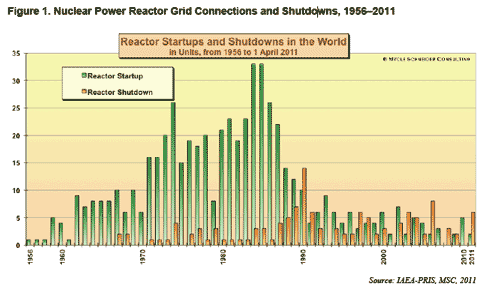
- There have been two major waves of grid connections since the beginning of the commercial nuclear age in the mid-1950s. (See Figure 1.) A first wave peaked in 1974, with 26 reactor startups. The second wave occurred in 1984 and 1985, the years preceding the 1986 Chernobyl accident, reaching the historical record of 33 grid connections in each year. By the end of the 1980s, the uninterrupted net increase of operating units had ceased, and in 1990 for the first time the number of reactor shutdowns outweighed the number of startups. The 2010 figure is not available yet.
- 稼働・発電・経年変化の概況
- 1950年代半ばからの商用原発時代の開始以来、2つの大きな波があり。第一の波は1974年で26基がスタート。第二の波は1984-85年で最大の33基が毎年稼働。1980年代後半には無制限の原発稼働の時代が終了。1990年には初めて閉鎖の基数が開始の基数を上回った。2010年の数字は未入手。
- Figure 1. Nuclear Power Reactor Grid Connections and Shutdowns, 1956–2011
- As of April 1, 2011, a total of 437 nuclear reactors were operating in 30 countries, down seven from the historical maximum of 444 in 2002. Since then, 25 units were started up and 32 were disconnected from the grid, including six units at the Fukushima plant in Japan. These are very conservative numbers since it is unlikely that the seven units that have been "provisionally" shut down in Germany following the Fukushima events will ever start up again.
- The current world reactor fleet has a total nominal capacity of about 370 gigawatts (GW or thousand megawatts). (See Figure 2 and Annex 2 for details.)
- <左図1> 原発の稼働・閉鎖状況:1956-2011
- 2011.4.1現在、437基が30ヶ国で稼働中。2002年の最大時より7基減少。その後25基が新規追加で32基が閉鎖 (福島の6基を含む)。但し福島事故を受けての独の7基の一時的閉鎖は含まれていない。
- 原発の発電容量は370 GW.
- Figure 2. World Nuclear Reactor Fleet, 1954–2011
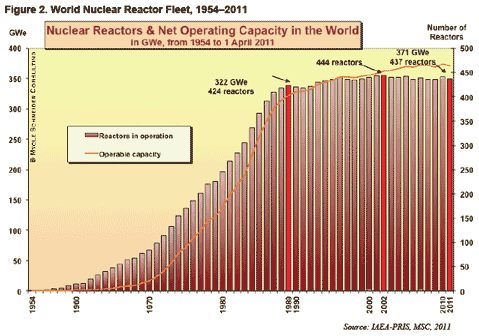
- The world installed nuclear capacity has decreased three times since the beginning of the commercial application of nuclear fission—in 1998, 2008, and 2009; in 2010, it incresed by 5.5 GW. Despite seven fewer units operating in 2011 compared to 2002, the capacity is still about 8 GW higher. This is a combined effect of larger units replacing smaller ones and, mainly, technical alterations at existing plants, a process known as "uprating." At least 1.8 GW of the capacity increase in 2010 is due to uprating.
- In the United States, the Nuclear Regulatory Commission (NRC) has approved 135 uprates since 1977. These included, in 2009–10, 10 minor uprates between 1.4 and 1.6 % and five "extended uprates" of 15–20 %. The cumulative additional approved uprates in the United States alone total 5.8 GW. Most of these already have been implemented, and applications for an additional 4.4 GW in increases at 13 units are pending.15 A similar trend of uprates and lifetime extensions of existing reactors can be seen in Europe. It is obvious that the main incentive for lifetime extensions is their considerable economic advantage over new-build.
- The capacity of the global nuclear fleet increased by about 3 GW annually between 2000 and 2004, much of it through uprating. Between 2004 and 2007, however, this dropped to 2 GW annually, and in 2008 and 2009 uprates were offset by plant closures, resulting in net declines in world nuclear capacity of about 650 MW and 860 MW, respectively.
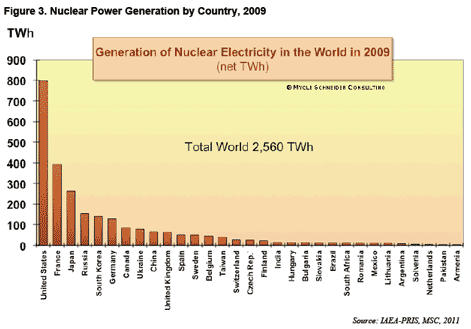
- The use of nuclear energy has been limited to a small number of countries, with only 31 countries, or 16 % of the 192 members of the United Nations, operating nuclear power plants in 2009.16 (See Figure 3.) One country, Lithuania, shut down its last reactor in 2009, so that currently only 30 countries operate nuclear power plants. Half of the world's nuclear countries are located in the European Union (EU), and they account for nearly half of the world's nuclear production. France alone generates close to half of the EU's nuclear production.
- As previously noted, there was no growth in nuclear electricity generation in 2009. The 2,558 TWh of nuclear energy produced corresponded to about 13 % of the world's commercial electricity.
- <左図2> 世界の原発発電容量: 1954-2011
- 世界の原発発電容量は、商用開始以来3回1998、2008、2009年と減少してきた。2010年には5.5GW増加。2011年には2002年に比べ7基減少したが、発電容量は8GW増加。これが大規模発電容量の原発に置き変わったことによる。2010年の容量増加は1.8GW。
- 米国では、1977年以来NRCは135基を認可。これらを含め、2009年には10基が1.4-16%と容量微増し、5基は15-20%容量増加。米国だけの容量増加は5.8GW。これはすでに設置済で、さらに13基の増加4.4GWが申請中。欧州では、同様の容量増加と既存原発の稼働寿命延長が見られる。寿命の延長は新設の場合より経済効果が高い。
- 2000-2004年の世界の原発容量は3 GW 増加し、その多くは容量増加による。但し2004-2007は、年間2GW減少し、2008-2009は容量増加と原子炉閉鎖とで相殺し、それぞれ650MWと860MWの減少となった。
- 2009年に原子力エネルギーを利用している国は31ヶ国と、国連加盟国192ヶ国中では小数の16%に限られる。現在稼働中はリトアニアを除く30ヶ国のみ。世界の原発による発電の半数はEUに位置し、その内の半数は仏にある。
- 2009年には原子力発電の伸びはなかった。原子力発電は2,558TWhで、これは世界の商用発電量の約13%に相当する。
- Figure 3. Nuclear Power Generation by Country, 2009
- Overview of Current New Build
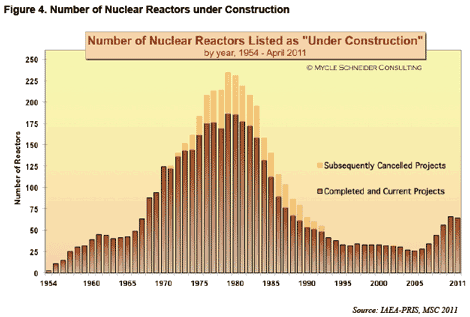
Currently, 14 countries are building nuclear power plants, and most of the sites are accumulating substantial and costly delays. As of April 1, 2011, the IAEA listed 64 reactors as "under construction," nine more than at the end of 2009. This compares with 120 units under construction at the end of 1987, and a peak of 233 such units—totaling more than 200 GW—in 1979. (See Figure 4.) The year 2004, with 26 units under construction, marked a record low for construction since the beginning of the nuclear age in the 1950s.
- <左図3> 国別原子力発電量: 2009
- 新設原発の概況:
現在14ヶ国で原発建設中。その大半は資金的理由で遅延。2011.4.1現在IAEAによれば、64基が建設中で、2009年に比べ9基増加予定。これは1987年末の建設中120基、ピーク時の1979年の建設中233基(200 GW) と比較できる。2004年には建設中26基で1950年代以降最低であった。
- Figure 4. Number of Nuclear Reactors under Construction
- The total capacity of units now under construction is about 62.5 GW, with an average unit size of around 980 MW. (See Annex 3 for details.) A closer look at currently listed projects illustrates the level of uncertainty associated with reactor building:
- Twelve reactors have been listed as "under construction" for more than 20 years. The U.S. Watts Bar-2 project in Tennessee holds the record, with an original construction start in December 1972 (subsequently frozen), followed by the Iranian Bushehr plant, which was originally started by German company Siemens in May 1975 and is now slated to be finished by the Russian nuclear industry. Other long-term construction projects include three Russian units, the two Belene units in Bulgaria, two Mochovce units in Slovakia, and two Khmelnitski units in Ukraine. The construction of the Argentinian Atucha-2 reactor started 30 years ago. In addition, two Taiwanese units at Lungmen have been listed for 10 years.
- Thirty-five projects do not have an official (IAEA) planned start-up date, including six of the 11 Russian projects, the two Bulgarian reactors, and 24 of the 27 Chinese units under construction.
- Many of the units listed by the IAEA as "under construction" have encountered construction delays, most of them significant. The remaining units were started within the last five years and have not reached projected start-up dates yet. This makes it difficult or impossible to assess whether they are running on schedule.
- Nearly three-quarters (47) of the units under construction are located in just four countries: China, India, Russia, and South Korea. None of these countries has historically been very transparent or reliable about information on the status of their construction sites.
- <左図4> 建設中の原発数
- 建設中の原発容量は62.5 GWで、一基の平均容量は980 MW。現在建設中の原発を子細に検討すると建設に掛かる不安定要因が見られる。
- 12基については、20年間以上も建設中となっている。米国テネシー州のWatts Bar-2は当初1972年に建設開始、その後凍結。イランのBushehrは独ジーメンスが1975年に建設開始したが、現在は露により作り直しとなっている。その他長期化している原発は露に3基、ブルカリアのBelene2基、スロバキアのMochovce2基、ウクライナのKhmeinitski2基がある。アルゼンチンのAtucha-2は30年前に建設開始した。さらに台湾のLungmenは10年間経過している。
- IAEAに建設中として登録済のかなりの原発は建設遅延があり、その多くは深刻化している。その他の原発は過去5年以内に着工したがまだ未完成。今後建設予定が順調かどうか評価は難しい。
- 建設中の約3/4の47基は、中・印・露・韓の4ヶ国である。これらの国々は建設状況が不透明で信頼性に欠ける。
- The geographical distribution of nuclear power plant projects is concentrated in Asia and Eastern Europe, extending a trend from earlier years. Between 2009 and April 1, 2011, a total of nine units were started up, all in these two regions.
- Lead times for nuclear plants include not only construction times but also long-term planning, lengthy licensing procedures in most countries, complex financing negotiations, and site preparation. In most cases the grid system also has to be upgraded—often using new high voltage power lines, which bring their own planning and licensing difficulties. In some cases, public opposition is significantly higher for the long-distance power lines that move the electricity than for the nuclear generating station itself. Projected completion times should be viewed skeptically, and past nuclear planning estimates have rarely turned out to be accurate.
- Past experience shows that simply having an order for a reactor, or even having a nuclear plant at an advanced stage of construction, is no guarantee for grid connection and power supply. French Atomic
Energy Commission (CEA) statistics on "cancelled orders" through 2002 indicate 253 cancelled orders in 31 countries, many of them at an advanced construction stage. (See also Figure 4.) The United States alone accounts for 138 of these cancellations.18 Many U.S. utilities suffered grave financial harm because of reactor-building projects.
- In the absence of any significant new build and grid connection over many years, the average age (since grid connection) of operating nuclear power plants has been increasing steadily and now stands at about 26 years.a Some nuclear utilities envisage average reactor lifetimes of beyond 40 years and even up to 60 years. The OECD’s World Energy Outlook 2010 recently gave a timeframe of 45–55 years, up five years from the 2008 edition of the report.
- 地理的にはアジアと東欧に集中。2009-2011.4.1の間に計9基が稼働開始した。
- 原発の場合は、建設期間だけでなく長期に亘る計画期間、長期に亘る認可取得、資金調達、サイトの準備が必要。多くの場合高圧送電網用の改良も必要。長距離送電に伴う反対運動も原子炉発電以上に深刻である。従って建設完工の時期は懐疑的で、過去の設計予測がほとんど正確でない。
- 過去の経験では、単に原子炉の発注した場合、あるいは建設が進んだ段階であっても、実際に発電に至るかどうか保証がない。仏の原子力委員会(CEA)によれば、キャンセルされた案件は、2002年に31ヶ国で253件もあり、その多くは建設がかなり進行。米国だけでもキャンセルされた案件は138件もある。このため米国では18の電力会社が財務損失を負った。
- In the United States, reactors are usually licensed to operate for a period of 40 years. Nuclear operators can request a license renewal for an additional 20 years from the Nuclear Regulatory Commission. More than half of operating U.S. units have received this extension. Many other countries, however, have no time limitations to operating licenses. In France, where the country's first operating PWR started up in 1977, reactors must undergo an in-depth inspection and testing every decade. The French Nuclear Safety Authority (ASN) evaluates on a reactor-by-reactor basis whether a unit can operate for more than 30 years. At this point, ASN considers the issue of lifetimes beyond 40 years to be irrelevant, although the French utility EDF has clearly stated that, for economic reasons, it plans to prioritize lifetime extension over massive new build.
- In assessing the likelihood of reactors being able to operate for up to 60 years, it is useful to compare the age distribution of reactors that are currently operating with those that have already shut down. (See Figures 5 and 6.) At present, 12 of the world's operating reactors have exceeded the 40-year mark.b As the age pyramid illustrates, that number will rapidly increase over the next few years. Nine additional units have reached age 40 in 2011, while a total of 165 units have reached age 30 or more.
- The age structure of the 130 units already shut down confirms the picture. In total, 32 of these units operated for 30 years or more; and within that subset, 16 reactors operated for 40 years or more. (See Figure 6.) The majority of these were Magnox reactors located in the U.K., most of which had been used to generate weapons-grade plutonium. These were all small reactors (50–225 MW) that had operated with very low burn-up fuel, and therefore are not comparable to large 900 MW or 1,300 MW commercial reactors that use high burn-up fuel that generates significantly more stress on materials.
- Here, reactor age is calculated from grid connection to final disconnection from the grid. In this report, "startup" is synonymous with grid connection and "shutdown" with withdrawal from the grid. b We count the age starting with grid connection, and figures are rounded by half years.
- While many units of the first generation have operated for only a few years or less, even the operating experience beyond 30 years is very limited. And considering that the average age of the 130 units that have already shut down is about 22 years, plans to nearly double the operational lifetime of large numbers of units seem rather optimistic.
- 米国では原発は通常40年間の稼働が許可される。さらにNRCの許可を得て、20年間の稼働延長ができる。米国の過半数の原発はこの延長申請を行った。他の多くの国では操業許可年数の限度なし。仏では最初のPWRは1977に稼働したが、十年毎に詳細な検査を義務づけられている。仏の原子力安全委員会(ASN)は、原子炉毎に30年以上の運転が可能かどうか評価する。仏電力EDFはこれは経済的理由で、最優先課題で40年以上の炉の寿命延長は当然と見なしている。
- 寿命60年までの稼働は可能としており、現在実際稼働中の炉、すでに廃炉になった炉は別表5の通り。現在、世界の原発で40年を越える炉は12基でその数は数年で今後増加。2011年には9基がこれに加わる。30年以上の炉は165基。
- すでに閉鎖された130基の炉の内早生は、30年以上が32基、40年以上が16基である。この大半が英国にあるMagnox炉で、その多くは兵器用の品質のプロトニウム生産に使用された。その容量は50-225MWと小さく、燃料の燃焼率も小さいので、600-1300MW級の商用炉は燃焼率が大きく燃料にストレスがかかる点が異なる。
- ここでは原発の開始とは電力網への組込時期であり、閉鎖とはそこからの分離時期で、半年単位は丸めてある。
- 第一世代の炉の運転は数年と短く、30年を越える稼働はしていない。130基の稼働平均は22年で、今後これは倍増される計画。
- Figure 5. Age Distribution of Operating Nuclear Reactors, 2011
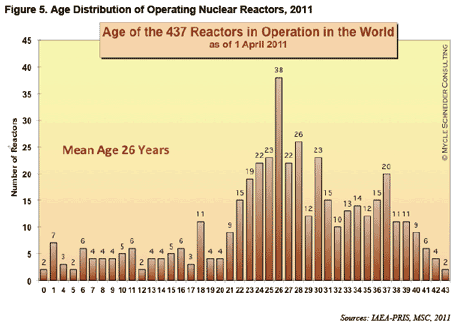
- <左図5:稼働中の原発の寿命分布>
- Figure 6. Age Distribution of Shutdown Nuclear Reactors, 2011
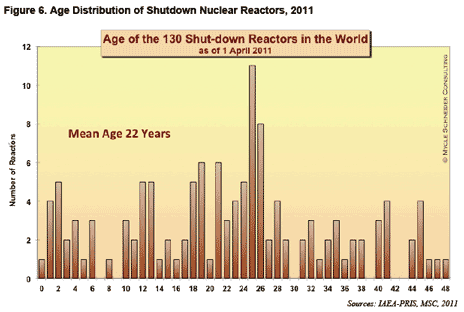
- After the Fukushima disaster, it is obvious that operating age will get a second look. The troubled Fukushima-I units (1 to 4) were initially connected to the grid between 1971 and 1974. The license for unit 1 was extended for another 10 years only in February 2011. Four days after the beginning of the drama in Japan, the German government ordered the shutdown (for a three-month period) of seven reactors that had started up before 1981. It is increasingly clear that the political climate in Germany makes a restart of these reactors highly unlikely. Other countries might follow in a less dramatic manner, but it is obvious that recent events are having an impact on previously assumed extended lifetimes.
- For the purposes of capacity projections, we have still assumed an average lifetime of 40 years for operating reactors, with a few adjustments. To remain conservative, we have considered, for example, that all 17 German units will be operated according to the current German legislation with remaining lifetimes between 8 and 14 years. Similarly, there are several individual cases where earlier shutdowns have been officially decided.21 (See Figure 7.)
- <左図6:閉鎖済の原発の寿命分布>
- 福島の事故以来、稼働年数に関しては見直しが必須。福島1〜4号機は1971おより1974年に稼働開始した。1号機の巨漢は2011.2に10年間延長したばかりだった。その4日後に事故がおこった。独政府は1981年以前に開始した7基の原の3ヶ月以内の閉鎖を命じた。独の政治状況ではこれらの原発の再開は困難。その他の国ではそれほど劇的でないにせよ、寿命延長課題への影響は必至。
- 原発発電容量の予測としては、40年寿命を前提にしてきた。控えめに見積もっても独の17基の原発は現行法の下での寿命は8-14年である。個別にはもっと早い段階での閉鎖もあり得る。
- Figure 7. The 40-Year Lifetime Projection
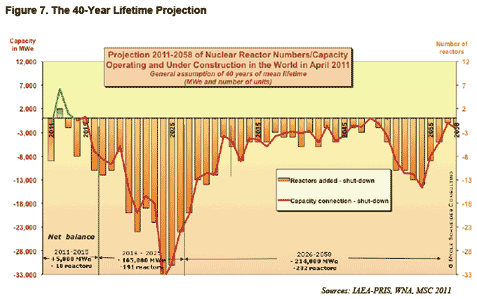
- The lifetime projections make possible an evaluation of the number of plants that would have to come on line over the next decades to offset closures and maintain the same number of operating plants. Besides 56 units under construction as of April 1, 2011a, and while capacity would increase by 5 GW (less than the seven German units currently off line), 18 additional reactors would have to be finished and started up prior to 2015. This corresponds to one new grid connection every three months, with an additional 191 units (175 GW) over the following 10-year period—one every 19 days. This situation has hardly changed from previous years
- Achievement of the 2015 target is simply impossible given existing constraints on the fabrication of key reactor components—aside from any post-Fukushima effect. As a result, the number of reactors in operation will decline over the years to come (even if the installed capacity level could be maintained) unless lifetime extensions beyond 40 years become a widespread standard. The scenario of generalized lifetime extensions is getting even less likely after Fukushima, as many questions regarding safety upgrades, maintenance costs, and other issues would need to be much more carefully a. Under the present scenario, 8 of the 64 units currently listed as under construction will enter operation after 2015.
Respective start-up dates have been compiled by MSC.
- Developments in Asia, and particularly in China, do not fundamentally change the global picture. Reported "official" figures for China's 2020 target for installed nuclear capacity have fluctuated between 40 GW and 120 GW. However, the average construction time for the first 10 operating units was 6.3 years. At present, about 27 GW are under construction. While the acceleration of construction starts has been very impressive—with 18 new building sites initiated in 2009 and 2010— the prospects for significantly exceeding the original 2008 target of 40 GW for 2020 now seems unlikely.a China has reacted surprisingly rapidly and strongly to the Fukushima events by temporarily suspending approval of nuclear power projects, including those under development (see chapter on post-Fukushima developments). But even doubling the current capacity under construction would represent only half of the capacity of 145 units that reach age 40 around the world until 2020.
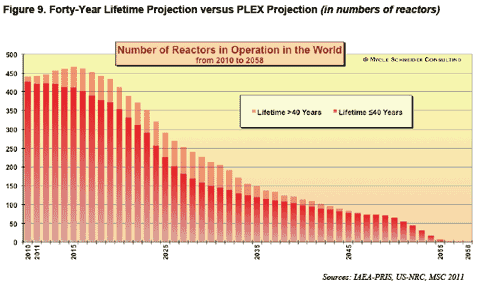
- We have modeled a scenario in which all currently licensed lifetime extensions and license renewals (mainly in the United States) are maintained and all construction sites are completed. For all other units we have maintained a 40-year lifetime projection, unless a firm earlier shutdown date has been announced. The net number of operating reactors would increase by 25 units and installed capacity by 35 GW in 2015 before rapidly declining, starting the same year. (See Figure 8.) The overall pattern of the decline would hardly be altered.24 (See Figure 9.) The Japanese events are likely to accelerate
the movement.
- Renewal of the aging world nuclear fleet, or even extension of the operating power plants, encounters four major problems: a short-term manufacturing bottleneck, a dramatic shortage of skilled worker
and managers, a skeptical financial sector, and public opinion. Other issues include widely fluctuating costs for raw materials, the aftermath of the Fukushima disaster, and the new dimension of the threatof nuclear terrorism. The world economic crisis has exacerbated these problems further, particularly in potential "newcomer" countries.
- <左図7: 40年寿命の場合の予測>
今後数十年に亘って、炉の廃止と新設を考慮すると、現状と同数の原発を維持するための今後の建設基数がわかる。2011.4現在、56基の原発が建設中で、その容量は5 GW。独では7基が廃止するので、2015までに、追加の18基の新設が必要。これは今後3ヶ月毎に1基の新設が必要で、今後10年間に191基 (175 GW)の新設が必要となる。これは19日毎に1基の新設という勘定。この状況は前年から変わっていない。
2015年の目標は、福島事故を別にしても、現状では不可能。従って、今後は、稼働中の原発は毎年減少していく。但し40年以上の寿命延長すれば状況は別。福島事故以降は、安全基準、運転コスト等慎重を要するので、一般的な寿命延長は無理。2015年以降新設されるのは8-64基となろう。
その開発は、特に中国。2020の中国の目標は40-120 GW. 但し最初の10基の平均建設期間は6.3年。現在約27 GWが建設中。今後建設開始が進むことで、2009-2010年には18基が新設されが、2020年に40 GWという当初の目標は無理。中国は福島事故に対応してすぐに建設中も含め原発計画を見直した。現状の基数が倍増されるとしても、2020年までに40年を迎える寿命の世界の原発145基の半数にした達しない。
前述のモデルは全ての寿命延長許可がなされ (特に米国で)全ての建設が順調な場合とした。その他の炉も40年寿命を前提とした。その結果、稼働中の原発は25基、35 GWが2015年に増加し、その後の急激な落ち込みを防ぐ。但し全体としての減少傾向は不変。日本の事故はこの減少傾向を加速する。
寿命延長には以下4つ課題がある。短期的には建設のボトルネック、熟練技師の不足、資金調達の困難、世論動向。他の要素そして原材料価格変動、福島の後処理、テロの要素、世界不況が新興国の問題を加速。
- Figure 8. The PLEX Projection.
- A certain number of units that are currently in the planning or early construction phases are designs that have never been
completed elsewhere, for example two EPRs and four AP1000s.
- <左図8>:新規の原子炉の投入が現在進行中。2基のEPRと4基のAP1000
- Figure 9. Forty-Year Lifetime Projection versus PLEX Projection (in numbers of reactors)
- > Continued:
- <左図9:40年寿命対PLEX (Plant Life Extension)予測>
>つづく:
-
Comment
- The above is the latest statistics of world nuclear plants
- 上記は世界原発に関する最新統計資料である。
Title |
Nuclear Powr in a Post-Fukushima World -2 | 福島後の世界の原子力 |
|---|---|---|
Index |
||
Tag |
30 countries; 437 reactors; 2,558 TWh (2009); 370 GW capacity; US-104, Fr-59, Jp-54, Ru. Kr, De, 3/4; Cn, In, Ru, Kr; Life time 40 years; 13% share |
|
Why? |
|
|
English original |
Japanese (abridged translation) |
>Top
3. General Overview Worldwide::
|
3. 世界原子力産業の概況:
|
|
|
|
|
|
|
|
|
|
|
|
|
|
|
|
|
|
|
|
|
|
|
|
>つづく: |
Comment |
|
|