English original |
Japanese (abridged translation) |
7. Nuclear Power vs. Renewable Energy Development:
- There could hardly be a more symbolic picture for the tête-a-tête of renewables and nuclear power than the March 2011 earthquake and tsunami in Japan. The disaster shut down 11 of the country's nuclear reactors, at least six of which are now condemned, but the Japanese Wind Power Association stated, "there has been no wind facility damage reported by any association member, from either the earthquake or the tsunami." Within three weeks of the disaster, Fukushima operator TEPCO, one of the five largest electricity utilities in the world, lost more than three-quarters of its share value, while the Japan Wind Development Company nearly doubled its stock price.
- The Fukushima crisis only exacerbates the major changes that the energy sector is facing due to a combination of environmental, resource, and demand factors. At the United Nations climate change conference in Cancún, Mexico, in December 2010, delegates agreed that "climate change is one of the greatest challenges of our time and that all Parties share a vision for long-term cooperative action." For the first time under the U.N. climate framework, participants acknowledged that "deep cuts in global greenhouse gas emissions are required according to science, and as documented in the Fourth Assessment Report of the Intergovernmental Panel on Climate Change, with a view to reducing global
greenhouse gas emissions so as to hold the increase in global average temperature below 2ºC above pre-industrial levels."
|
7. 原子力エネルギー対再生可能エネルギー:
- 2011.3.の日本での地震と津波ほど再生可能エネルギーと原子力エネルギーが象徴的な対比となったことはない。その悲劇にyほって日本の原発11基が閉鎖し、少なくともその内の6基は糾弾されている。一方、日本風力発電協会によれば、"地震や津波による風力発電の被害報告はない"とのことである。事故の3週間以内に、福島原発を運転している世界で5番目に巨大な東京電力はその3/4の株価が下落し、一方日本風力発電株式会社の株価は倍増した。
- 福島の危機は、エネルギー部門が、環境、資源、需要要因の組合せによって大きな変化を生じさせている。国連では、2010.12にメキシコのCancúnでの気候変動会議で、代表団は、"気候変動は我々の時代の最大の課題であり、すべての当事者は長期の協力行動をシェアすべき"と合意した。まず国連の機構フレームワークとして、参加国は"科学に基づき温室効果ガスの大幅カットが必要であり気候変動に関する第4会国際評価報告書に記載され、温室効果ガスの増加を抑制し、地球の温度上昇を産業革命時点より2ºCプラス以下にすべきとした。"
|
- This statement not only confirms the scientific framework by which global emissions should be measured, but it enables calculations to be made about the volume of greenhouse gases that can be safely released to the atmosphere to avoid serious climatic disruption. Estimates indicate that global emissions must be cut roughly 80 % by 2050, requiring the effective "decarbonization" of the energy sector. Given that the expected lifetime of investments in energy infrastructure, grids, and power stations typically exceeds 50 years, all new projects built today should fulfill these sustainability criteria or face premature retirement. Although a large number of "low-carbon" technologies are both being deployed and under development, particularly in the renewable energy arena, the key factor is how (and if) these fit together into a zero-emissions energy sector.
- Traditional energy forecasts anticipate rapid increases in energy demand, driven primarily by the need to fuel Asia's growing economies, particularly in China and to a lesser extent in India. The International Energy Agency assumes that, if current policies continue, global energy demand will increase 47 % by 2035. Based on this scenario, energy consumption in China will effectively triple, whereas in the European Union and the United States it will increase about 4 %.
|
- この報告書は、単にグローバルな排出が測定可能な科学的な仕組みを確認しただけでなく、環境に深刻な影響を与えないように安全に大気中に放出できる温室効果ガスの量を計算できることを示した。その試算によれば、グローバルな排出は2050年までに80%で、エネルギーの脱炭素化を求めている。エネルギーインフラ、電力網、発電所は50年を越える投資のライフタイムを考慮すると、今日から建設されるすべての新規プロジェクトはこの基準を満たすか、あるいは早期の廃棄を迫られることになる。多数の"低炭素"技術が、特に再生可能エネルギー分野で配備され、開発されるとしても、キーの要素となるのは、これらが炭素を排出しないゼロエミッションの分野に適合するかが問題となる。
- 従来のエネルギー予測では、特にアジアの新興国、中国や次ぎにインドで急激な需要な見込まれている。国際エネルギー機関 (IEA)では、現在の政策が継続すると、エネルギー需要は2035年までに47%も増加すると予測している。このシナリオでは、中国のエネルギー需要は3倍となり、一方EUや米国は4%増加する。
|
- Over the medium term, a pressing concern is the availability of suitable energy resources—particularly liquid fuels—and the associated impact on both supply and consumer prices. The U.K. Energy Research Centre estimated in 2009 that the average annual rate of decline from oil fields that are past their peak of production is at least 6.5 %, while the decline from currently producing fields is at least 4 %. Just maintaining the current level of output would require 3 million barrels a day of new capacity each year, equivalent to the production of Saudi Arabia over three years. And this does not take into account the growing demand from developing countries. The situation for oil is particularly acute, but concerns about the availability of other fossil fuels, such as natural gas, in some countries and regions is affecting their price significantly.
- From the perspective of both climate security and traditional supply security, the current energy system and the policies that shape it are highly unsustainable. The new energy system must be based on two pillars. Firstly, energy efficiency must be at the heart of any new energy system, because meeting the anticipated increase in energy demand at current efficiency levels is not an option given the growth in population and changing consumption patterns. As the European Commission points out, "energy savings is one of the most cost effective ways" to address concerns about climate change and the security of energy supplies.
|
- 中期的には、差し迫った関心事はエネルギー資源、特に石油資源に対して需給価格にどう影響するかである。英国エネルギー研究センターの2009年の予測では、石油生産は、生産のピークを過ぎた油田では、少なくとも年6.5%で減少し、一方、現在生産中の油田は少なくとも4%の減少となっている。現在の石油生産量を維持するには日量3百万バーレルの新規生産が必要となり、これはサウジアラビアの3年分の生産量である。このことは途上国の需要増大を考慮していない。石油の状況は特に厳しいが、その他の化石燃料として、例えば、天然ガスの可能性があるが、一部の国ではその価格にも相当影響が出ている。
- 気候問題と従来のエネルギー供給問題双方を考慮すると、現在のエネルギーシステムと政策は維持可能ではない。新エネルギーシステムに関しては2つの柱がある。まず第一に、新エネルギーシステムの中心にはエネルギー効率がある。現在の効率レベルでは、人口増加や消費パターンの変化に対応できない。EU委員会は、気候変動やエネルギー供給問題に対応するには、"省エネルギーが最も効果のある対策の一つ"と指摘している。
|
- The second pillar of the new energy system is no (or extremely low) carbon dioxide emissions. This decarbonization could come from three sources: nuclear power, fossil fuels (using emissions capture and storage), and renewable energy. Supporters of nuclear power believe that nuclear should play an increasingly important role in this new, highly efficient, zero-emissions energy sector, since in their view all low-carbon technologies will be needed. But this claim must be addressed from multiple perspectives.
- An Economic Comparison
- When evaluating the role of nuclear power in the global energy mix, it is important to consider the types of support that nuclear receives compared with other technologies. Proponents of new energy technologies argue that direct government support is needed to enable these to compete with established technologies. Nuclear power has been in commercial operation for more than 50 years, yet it continues to receive large direct and indirect subsidies, in part because electricity prices fail to reflect the full environmental costs, and because of government guarantees for the final storage or disposal of radioactive waste. In the United States, even though nuclear and wind technologies produced a comparable amount of energy during their first 15 years (2.6 billion kWh for nuclear versus 1.9 billion kWh for wind), the subsidy to nuclear outweighed that to wind by a factor of over 40 ($39.4 billion versus $900 million).
- Re: CO2 emission regarding nuclear power plant should include t emission during whole nuclear life cycle, including uranium mined and transported by oil fuel, enrichment and fabrication process, reprocessing of spent fuel, construction and decommissioning of nuclear plant, control of radioactive waste as well as disposal of warm water into environment which may cause more CO2 emission from warmed sea water.
|
- 2つめの柱は、新エネルギーシステムで、これはCO2を排出しない。この脱炭素には3つの方策がある。原発、化石燃料で排出補足・保管、再生可能エネルギーである。原発の推進者は、原子力が、効率性や脱炭素において極めて重要であるとしている。但しこの考えはもっと多角的な視点から検討する必要がある。
- 経済的な比較
- グローバルなエネルギーミックスの中での原発を評価すると、原発は他の技術と比較して得ている支援の種類を考慮する必要がある。新エネルギーの推進者としては、既存のエネルギーと競合するには政府の直接支援が必要であると主張している。原発は商用運転をすでに50年以上も行ってきたが、まだ巨額の直接・間接の補助金を得ている。その一部の理由としては、電力料金がすべての環境コストを反映しておらず、政府が放射性廃棄物の最終処分を保証していることもある。米国では、原発と風力とを最初の15年間の補助金を比較すると (原発2.6B kWhに対し風力1.9B kWh)、原発への補助金が40倍もある。(原発$39.4B対風力$0.9B)
- 注)原発の発電だけでなく、石油による燃料サイクルや原発設備建設と廃棄、核廃棄物管理など、あるいは発電時の温排水放流によるCO2増加効果などすべてのライフサイクルでのCO2排出を計算すべきである。
|
- Figure 11. Government Research and Development Budgets across IEA countries 1986–2008
(billion $2008)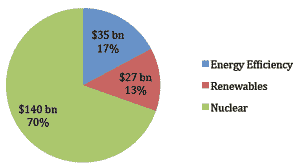
- Source: IEA 2011
- Even with the demise of new orders for nuclear power and the rise of other energy technologies, nuclear continues to enjoy unparalleled access to government research and development (R&D) funding. Analysis from the IEA shows the dominance of nuclear power, both fission and fusion, within R&D budgets—commanding nearly two-thirds of total expenditures in recent decades. (See Figure 11 above.) Compared with renewables, nuclear power has received roughly five times as much government R&D finance since 1986 across the countries of the IEA.
|
- <左図11:政府のエネルギー開発予算、1986-2008>
- 政府の開発予算額では、何と言っても原子力関連 (核分裂と核融合を含む)の開発費が約70%と圧倒している。1986以来のIEA加盟国全体では、原子力関連は新エネルギー関連の約5倍の開発予算を使っている。
|
- Figure 12. Solar and Nuclear Costs: The Historic Crossover
Source: Blackburn and Cunningham 2010
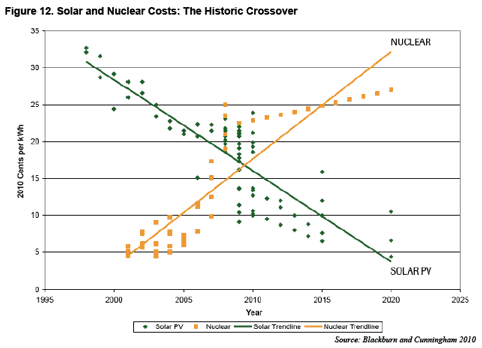
- Green line: Solar Trendline
- Orange line: Nuclear Trendline
- Crossover year: 2010
|
- Y軸:2010 Cents/kWh
- X軸:Year (1995 - 2025)
- Green line: 太陽光トレンド
- Orange line: 原子力トレンド
- 交差年:2010年
|
- Moreover, the building of new nuclear power plants, which is being proposed for the first time in decades in some developed countries, will require further government subsidies or support schemes, such as production tax credits, insurance for cost overruns, and more. With increasing constraints on public-sector spending, state support for one technology will mean less support available for others.
- Despite the disproportionately lower support historically, some analysts consider solar photovoltaic (PV) energy to be competitive with nuclear new-build projects under current real-term prices. The late John O. Blackburn of Duke University calculated a "historic crossover" of solar and nuclear costs in 2010 in the U.S. state of North Carolina. Whereas "commercial-scale solar developers are already offering utilities electricity at 14 cents or less per kWh," Blackburn estimated that a new nuclear plant (none of which is even under construction) would deliver power for 14–18 cents per kWh.11 (See Figure 12 above.) Solar electricity is currently supported through tax benefits but is "fully expected to be cost-competitive without subsidies within a decade," he noted.12
|
- 更に、一部の先進国で何十年間も、新規の原発建設の際には、政府の補助金や支援の仕組み、例えば、税の免除、コスト超過の場合の保険など。公的な支出増加圧力が強まると、1エネルギーに対する支援は他のエネルギーへの支援が減少する。
- 歴史的には、非対称的に、支援レベルは低かったが、太陽光 (光起電)エネルギーは現在の実勢価格で比較すると、新設の原発コストに匹敵する。Duke大学の故Joh O. Blackburnの計算によれば、米国ノースカロライナ州では2010年に太陽光と原子力のコストが"歴史的交差"したと計算した。商用スケールでの太陽光発電コストは14セント/kWhであり、これは新設原発の場合のコスト14-18セント/kWhを凌駕した。太陽光発電は現在税優遇を受けているが、"十年以内には税優遇なしでもコスト競争力がある"とされている。
|
- Rapid and Widespread Deployment
- Because the transition from fossil fuels to low-carbon energy sources needs to be rapid and global, technologies that are widely available today and that can be implemented in the short term have a clear advantage. Given the need for immediate reductions in greenhouse gas emissions, the time needed to introduce new technologies on a mass scale is a crucial parameter. The commissioning of new energy generating facilities involves two major phases, pre-development and construction, and both must be considered when comparing the benefits of technologies to emissions reduction.
- The pre-development phase can include wide-ranging activities such as conducting extensive consultations, obtaining the necessary construction and operating licenses, getting consent both locally and nationally, and raising the financing package. In some cases, technology deployment may be sped up through the use of generic safety assessments. Alternatively, pre-development may take longer than expected because of local site conditions or new issues coming to light.
- The IEA has estimated a pre-development phase of approximately eight years for nuclear power. This includes the time it takes to gain political approval but assumes an existing industrial infrastructure, workforce, and regulatory regime. In the case of the United Kingdom, then-Prime Minister Tony Blair announced that nuclear power was "back with vengeance" in May 2006, but it was some years before nuclear pre-development even began.
- With regard to construction, nuclear power has a history of delays. (See Table 3.) According to the World Energy Council, the significant increase in construction times for nuclear reactors between the late 1980s and 2000 was due in part to changes in political and public views of nuclear energy following the Chernobyl accident, which contributed to alterations in the regulatory requirements.
|
- 迅速かつ広範囲の普及:
- 化石燃料から低炭素エネルギー源への転換は、急速かつグローバルに進展しており、今日では技術的にも可能で、短期間に明らかに有利となろう。温室効果ガス削減に即効性があり、新技術の大量導入は必須の課題となってきた。新エネルギー発電設備を導入するには二段階がある。まず開発前段階と建設段階であり、いずれも技術と炭素排出削減のメリットを比較検討する必要がある。
- 開発前段階とは、広範囲なコンサルテーション、建設および稼働の許可取得、国・地域の了解取得、資金調達など広範な活動を要する。ある場合には、技術展開が、包括的安全評価を通じて加速する場合もあれば、逆に、設置場所の条件や新たな課題で予想以上に時間がかかる場合もある。
- IEAは、開発前段階は、原発の場合8年かかる。これは政治的な承認を得る期間で、産業のインフラ、労働力、規制の体制があるものという前提である。英国の場合、当時のTony Blair 首相曰く、原発は2006.5に"牙をむいて襲いかかって来る"と言ったが、それは原発の開発前の数年間であった。
- 建設に関しては、原発は遅延の歴史である。世界エネルギー会議 (World Energy Council) によれば、原発の建設期間は1980年代〜2000年の間で大きく遅延しており、これはチェルノブイリ事故以降の政治的また世論の変化を踏まえて、規制当局の変更があったためである。
|
- Table 3. Construction Time of Nuclear Power Plants Worldwide, 1965–2010
Years Number of Reactors Average Construction Time
(months)
-
Years |
Number of reactors |
Av. Construction Time (months) |
| 1965–1970 |
48 |
60 |
| 1971–1976 |
112 |
65 |
| 1977–1982 |
109 |
80 |
| 1983–1988 |
151 |
98 |
| 1995–2000 |
28 |
116 |
| 2001–2005 |
18 |
82 |
| 2005–2010 |
10 |
71 |
Note: The 2005–10 range does not include completion of Romania's Cernavoda 2 unit, which took 279 months, and Russia's Rostov unit, which took 322 months, due to an extended break in construction.
- It is important to note the differences in construction of a wind farm (and many other renewable energy schemes) compared to conventional power stations. The European Wind Energy Association (EWEA) likens building a wind farm to the purchase of a fleet of trucks: the turbines are bought at an agreed fixed cost and on an established delivery schedule, and the electrical infrastructure can be specified well in advance. Although some variable costs are associated with the civil works, these are very small compared to the overall project cost. The construction time for onshore wind turbines is relatively quick, with smaller farms being completed in a few months, and most well within a year.
- The contrast with nuclear power, and even conventional fossil fuel power plants, is significant. Looking at the net additions to the global electricity grid over the last two decades, nuclear power added some 2 GW annually on average during the beginning of this period, compared with a global installed capacity of some 370 GW today. (See Figure 13.)
|
- <左表3:世界の原発の建設期間: 1965-2010>
- 風力群(および他の再生可能エネルギー)の建設期間は、従来の発電所の場合の違いは重要である。欧州風力エネルギー協会 (EWEA)は、風力群はトラック群を購入することに例えている。タービンは合意した固定価格で購入し、予定通り納入される。電気のインフラは前もって準備される。土木工事に関しては、若干のコスト変動はあり得るがプロジェクト全体に比べれば少額である。陸上の風力タービンは迅速に設置され、小規模風力群であれば数ヶ月、せいぜい1年以内に完成する。
- これに対し原発や従来の化石燃料の発電所はもっと重大である。過去20年間の世界の電力網への追加を見ると、平均毎年2GWの原発が追加されてきており、この結果現在の原発容量は370GW程度となった。
|
- Figure 13. Net Additions to Global Electricity Grid from New Renewables and Nuclear, 1990– 2010 (in GW)
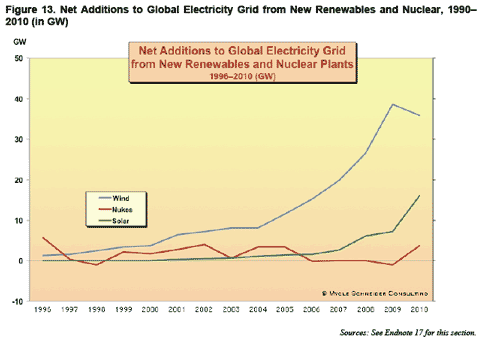
- Blue line: Wind power
- Green line: Solar power
- Red line: Nuclear power
- However, this trend has stagnated or decreased since 2005. Over the same period, global installed wind power capacity increased more than 10 GW annually on average, rising steadily to more than 37 GW in 2009 and 35 GW in 2010. Solar PV has accelerated rapidly in recent years as well.
- In 2010, for the first time, the cumulative installed capacity of wind power (193 GW), small hydropower (80 GW), biomass and waste-to-energy (65 GW), and solar power (43 GW) reached 381 GW, outpacing the installed nuclear capacity of 375 GW prior to the Fukushima disaster. Although renewable electricity generation (excluding large hydro) will remain lower than nuclear output for a while, it is catching up fast.
- Total investment in clean energy technologies increased 30 % in 2010 to $243 billion globally, a nearly fivefold increase over 2004. China is the world leader, investing $54.4 billion in renewables in 2010 (up 39 % over the previous year), followed by Germany at $41.2 billion (up 100 %) and the United States at $34 billion (up 66 %). (See Table 4.) Italy more than doubled its renewable energy investments in 2010, to $13.9 billion, jumping in rank from 8th to 4th. Extension of a favorable feed-in tariff is expected to more than double Italy's installed PV capacity in 2011 to around 8 GW—the government's target for 2020.
|
- <左図13:新規に追加された再生可能エネルギーと原発の発電容量;1990-2010> (単位GW)
- 青色:風力発電
- 緑色:太陽光発電
- 赤色:原子力発電
- しかし、この傾向は2005年以降行き詰まり、減少した。同時期に風力エネルギー容量は毎年平均10GW増加し、2009年は37GW、2010年は35GWを順調に伸びた。太陽光発電は最近また急増している。
- 2010年には初めて、累積の発電容量では、風量エネルギは193GW、小規模水力は80GW、バイオマスと廃棄物発電(WTE)は65GW、太陽光43GWで、合計381GWとなり、福島事故の前までに原発の発電容量375GWを追い抜いた。再生可能エネルギーの発電 (大規模水力を除く)はしばらくは原発の発電量以下だが、まもなく追い付く。
- 世界のクリーンエネルギー投資額は2010年に30%増加して$2430億となり、これは2004年の5倍に達した。中国は世界のリーダーで、2010年には再生可能エネルギーに$544億投資し (対前年比39%増)、次いで独の$412億 (同100%増)、米国の$340億 (同66%増)、伊は倍増して$139億投資で8位から4位に上昇した。固定価格買取制度(FiT)の導入で、2011年には伊の太陽光発電容量は8GWに倍相する見通しである。(政府の2020年目標)
|
- Table 4. Renewable Energy Investment, Top 10 Countries, 2009 versus 2010
-
2010 Rank |
Country |
2010 Investment ($B) |
2009 Investment ($B) |
2009 rank |
1 |
China |
54.4 |
39.1 |
1 |
2 |
Germany |
41.2 |
20.6 |
3 |
3 |
US |
34.0 |
22.5 |
2 |
4 |
Italy |
13.9 |
6.2 |
8 |
5 |
Rest of EU27 |
13.4 |
13.3 |
4 |
6 |
Brazil |
7.6 |
7.7 |
7 |
7 |
Canada |
5.6 |
3.5 |
9 |
8 |
Spain |
4.9 |
10.5 |
6 |
9 |
France |
4.0 |
3.2 |
12 |
10 |
India |
4.0 |
3.2 |
11 |
- Part of this rapid scale-up is due to the geographical diversity of renewable energy deployment. According to the Global Wind Energy Council, some 50 countries are home to more than 10 MW of installed wind power capacity, compared to 30 countries operating commercial nuclear reactors. Although the majority of renewable energy countries are in Europe, there is widespread deployment of wind power in Egypt (550 MW), New Zealand (500 MW), Morocco (286 MW), and the Caribbean (99 MW). Markets in emerging and developing countries now determine growth in wind power, and in 2010 for the first time, more than half of newly added wind power was installed outside of Europe and North America.
- China in particular has become the global leader for new capacity in both nuclear and wind power. Forty % of all reactors under construction are in China. The extent to which both technologies are expected to grow is unparalleled, although the installed capacity for wind power, at roughly 45 GW, is currently more than four times that for nuclear (roughly 10 GW). (See Figure 14.)
|
- <左表4:再生可能エネルギー投資、トップ10ヶ国、2009>
- 再生可能エネルギーの急激な展開には地域差がある。Global Wind Energy Council (世界風力発電会議)によれば、約50ヶ国で家庭用から10MW規模まであり、これは原発稼働の30ヶ国を上回る。風力の主要国は欧州だが、エジプト(550MW)、ニュージーランド(500MW)、モロッコ(286MW)、カリブ海(99MW)へと拡大している。新興国や途上国では風力発電の伸びは定番となっており、2010年には、半分が欧米以外に新規設置された。
- 特に、中国は、原発も風力発電も両方とも世界のリーダーになっている。建設中の原発の40%は中国で、両方の技術を開発中。現状では、風力発電容量は45GWで、原発10GWを上回っている。
|
-
Figure 14. Installed Nuclear and Wind Power Capacity in China, 1991–2010 and Projections to 2020 (MW)
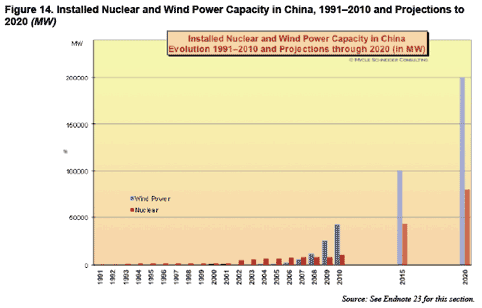
- Blue bar: Wind power
- Red bar: Nuclear power
- Even with a 3–4 times lower load factor, wind is likely to produce more electricity in China in 2011 than nuclear. China's wind power growth is so dramatic that the country must continually raise its production targets, as they are repeatedly being met prematurely. China is not only a major implementer of wind technologies, but a global player in related manufacturing. In India, meanwhile, wind generation outpaced nuclear power already in 2009, according to data from the U.S. Department of Energy.
- In the United States, no new nuclear capacity has been added since the Watts Bar-2 reactor in Tennessee was commissioned in 1996, after 23 years of construction. Meanwhile, the share of renewables in newly added U.S. electricity capacity jumped from 2 % in 2004 to 55 % in 2009. And although Germany provisionally shut down seven of its reactors after the Fukushima disaster, if the remaining 10 units generate a similar amount of electricity as they did in 2010, then in 2011 for the first time ever renewable energy will produce more of the country's power than nuclear. Four German states generated more than 40 % of their electricity from wind turbines alone already in 2010.
- An analysis by the European Wind Energy Association (EWEA) shows that while more than 100 GW of wind and solar were added to the EU power grid between 2000 and 2010, nuclear generation declined by 7.6 GW, joining the rapidly declining trend of coal- and oil-fired power plants. (See Figure 15.)
|
- <左図14:中国における原発および風力エネルギー設置推移、1991-2010、2020予測(MW)>
- 風力発電の利用率(負担率)は3-4倍も低いが、中国では2011には風力の方が原発より発電量が多い。中国の風力発電の伸びは目覚ましく、まだ今後急速に伸びる見込み。中国は風力発電の設置だけでなく、風力の関連技術でも主要生産国である。インドでは、風力発電が2009年にはすでに原発を追い越している。
- 米国では1996年にテネシー州のWatts Bar-2が稼働して以来、23年間も新規の原発が追加されていない。一方、米国の再生可能エネルギーは2004年の2%から2009年の55%へと急増した。独は福島事故の後、7基を停止させたが、残りの10基は2010年と同量を発電している。2011年には再生可能エネルギーが原発の発電量を超える。独の4州では、2010年にはすでに発電量の40%は風力発電である。
- 欧州風力エネルギー協会(EWEA)の分析では、2000-2010の間に、EUの風力と太陽光発電が100GW供給追加となち、一方、原発は7.6GWの減少となり、これは石炭、石油火力と同じく急速に減少している。
|
- Figure 15. Cumulative Electricity Additions in the European Union, by Energy Source, 2000–10
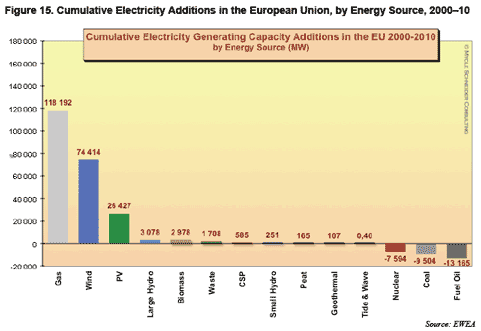
- Mostly increasd: Gas > Wind > Solar (PV)
- Mostly decrease: Fuel Oil > Coal > Nuclear
- Are Nuclear and Renewables Compatible?
"If someone declares publicly that nuclear power would be needed in the baseload because of fluctuating energy from wind or sun in the grid, he has either not understood how an electricity grid or a nuclear power plant operates, or he consciously lies to the public. Nuclear energy and renewable energies cannot be combined."
—Siegmar Gabriel, then-Federal Environment Minister of Germany
- From a systemic perspective, the key question is whether nuclear energy is in fact compatible with a power system that is dominated by energy efficiency and, in particular, by renewable energy. Experience in places where renewables account for a rapidly growing share of electricity generation, such as Germany and Spain, suggests that efficient "co-dominant" systems are not possible. The main reasons are as follows:
- Overcapacity kills efficiency incentives. Large, centralized power-generation units tend to lead to structural overcapacities. Overcapacities usually lead to lower prices, which discourages energy efficiency. Lower prices also stimulate consumption or inefficient uses, often leading to higher electricity bills.
- Renewables need flexible complementary capacity. Increasing levels of renewable electricity will require flexible, medium-load complementary facilities rather than inflexible, large, baseload power plants. Johannes Lambertz, CEO of RWE Power, one of Germany's largest electricity utilities, observed in 2010 that, "what is most important for the energy industry is the wise integration of renewable energies into the power generation market." In Germany, the injection of renewable electricity has legal priority over nuclear and fossil power. But in October 2008, wind energy generation was so high that some non-renewable electricity had to be offered for "negative" prices on the power market because utilities could not reduce the output from nuclear and coal plants quickly enough—even though some 8 GW of nuclear capacity was off line for maintenance. Since then, negative electricity prices, legal in Germany since September 2008, have become a more frequent phenomenon: in the six months between September 2009 and February 2010, power prices in Germany dropped into the red on 29 days. Negative prices, a sort of financial penalty for inflexibility, reached stunning levels: on October 4, 2009, one power producer had to pay up to €1,500 per megawatt-hour (15 cents per kilowatt-hour) to get rid of its electricity.
- Future grids go both ways. Smart metering, smart appliances, and smart grids are on their way, and received considerable emphasis in the economic stimulus packages of many countries in 2008. Under this entirely redesigned grid system, which is radically different from the top-down centralized approach, the user also generates and stores power. The consumer becomes producer and vice-versa, giving rise to the "prosumer."
- In many developing countries, where key decisions about grid infrastructure have yet to be made, it is critical to assess the implications of these basic system choices. Industrial countries illustrate the outcome of past strategic choices. Unfortunately, although there are numerous successful local and regional cases, there is no "good" example of a successful national energy policy that provides affordable, sustainable energy services. All countries have implemented policies that have serious drawbacks, and major "repair jobs" are necessary to address the defaults.
- > Continued:
|
- <図15:EUでの電源別累積追加発電量、2000-2010>
- 大幅増加:ガス>風力>太陽光
- 減少:石油>石炭>原子力
- 原子力と再生可能エネルギーは両立するか?
- "もし原発がベースロードとして必要で、その理由は風力や太陽光が電力系統として変動エネルギーであるからと公言したとしたら、その人は電力系統かあるいは原発かいずれかを理解していないか、あるいは、意図的に大衆を欺いていることになる。原発と再生可能エネルギーとは一緒には論じられない。" - Siegmar Gabriel, 独環境大臣(当時)
- システム的な視点では、この質問の主旨は、エネルギー効率に支配される発電システムとして、原子力は再生可能エネルギーと両立し得るかということである。独や西にように、発電として急速に成長しつつある再生可能エネルギーの経験で言えば、効率的な"主要電源"システムとしては可能ではないと言える。その理由は以下である。
- 過剰容量は効率性というインセンティブをなくす。巨大集中発電設備は構造的に過剰容量となる傾向がある。過剰容量は、通常低価格に通じ、エネルギー効率の追求しなくなる。低価格はまた消費や不要な利用を刺激し、しばしば高額の電気料金に通じる。
- 再生可能エネルギーは柔軟で補完的な容量である。再生可能エネルギーを増やす際も、固定的で巨大なベースロードの発電所ではなく、柔軟で中規模の補完的な設備を必要とする。独の大手電力の一つであるRWE電力のJohannes Lambertz CEOは、2010年の状況を見て曰く、"エネルギー業界にとって最重要課題は、再生可能エネルギーをいかにうまく発電市場に組み込んでいくかである。" 独では、再生可能エネルギーの組込は原子力や化石燃料より法律で優先される。しかし2008.10には、風力発電が高かったので、再生可能エネルギーでない電力は電力市場から"ネガティブ"価格を提案された。その理由は電力は原発や石炭火力を早急に発電を減らすことができなかったからである。原発は8GWも点検のため停止していたにも関わらずである。それ以来、ネガティブ発電価格は2008.9より独では合法となり、頻繁に見られるようになった。
- 2009.9から2010.2にかけて独の電力料金は29日間赤字となった。ネガティブ価格とは柔軟性のなさに対する一種の財政的なペナルティで、驚くほどのレベルに達している。2009.10.4には、一つの電力は、電力処分のために€1,500 /MWh (15セント/kWh)を支払った。
- 将来の電力系統は双方向となる。スマートメーター、スマートアプライアンス、およびスマートグリッドなどである。この完全に再構築されたグリッドシステムの下で、それはトップダウンの中央集権的なアプローチとは全く異なるやり方で、ユーザも活性化してパワーを貯えていく。消費者も生産者となり、その逆もあり得るので、プロシューマーの登場である。
- 途上国の多くでは、電力グリッドインフラについての重要な意志決定がなされておらず、基本的な電力システムをどうするかの選択が極めて重要となる。工業国は過去の戦略的選択の結果がそれなりに明確になっている。しかし不幸なことには、地域やローカルレベルの成功事例はあるものの、国家レベルでの、相応でかつ持続可能なエネルギーを提供するエネルギー政策の良い成功事例はない。すべての国の政策には欠点があり、その主要な欠点は修復する必要があるということである。
- > つづく:
|


